In Search of Models that Yield Insight
Posted on Sat 10 October 2020 in tech
"The purpose of computing is insight, not numbers." (Richard Hamming)
"The reason we model and analyze systems is to gain insight." (C. Nelson Dorny)
At the beginning of April, with the COVID-19 outbreak upending much of life as we previously knew it, I was casually following the case count numbers from various sources. I eventually gave in to the urge to start tinkering with visualizations and started plotting the data from my home state of Utah. I originally took inspiration from Matt Harrison's daily plots of the data on LinkedIn, but I ultimately ended up taking a different route to the visualizations that was geared toward examining the commonality in the shape of the growth curves and the phase relationships between the various reported statistics. I've since been updating the plots daily and storing the snapshots to GitHub. An example snapshot from a typical day is below.
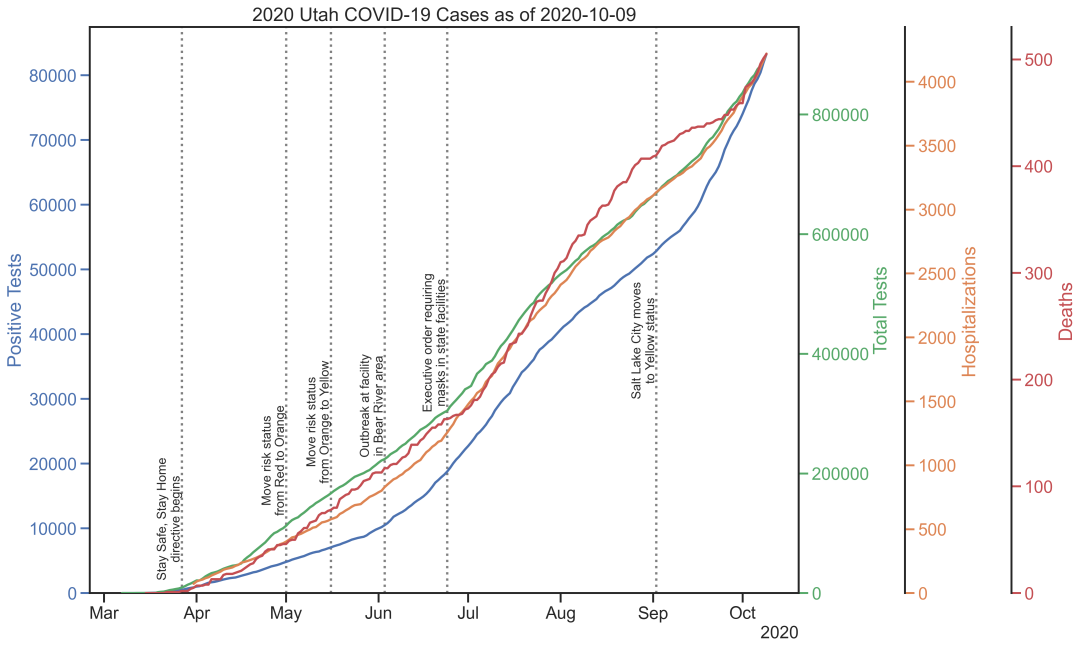
Utah COVID-19 data. (Source)
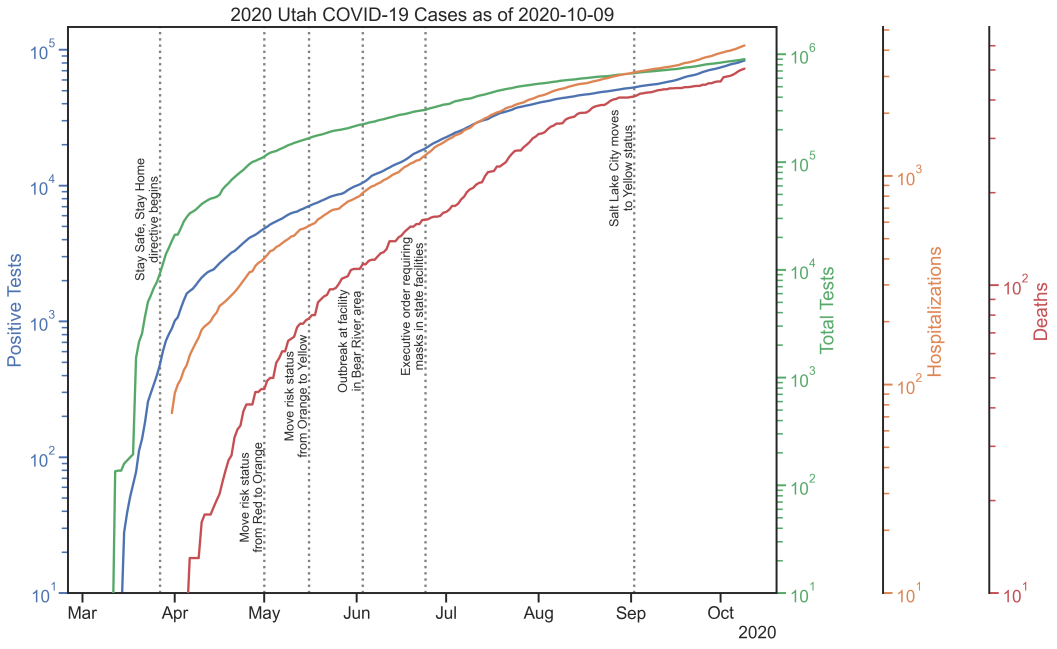
Utah COVID-19 data, log scale. (Source)
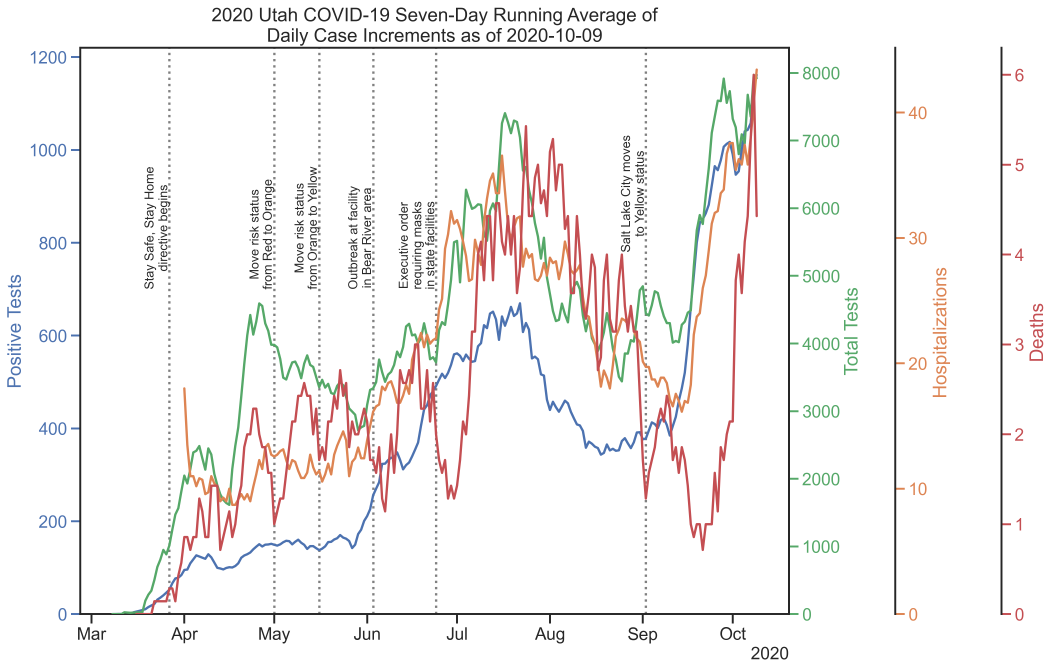
Utah COVID-19 data, seven-day running average of daily case increments. (Source)
While the underlying case count data are admittedly an approximate proxy for the true state of the pandemic, the plots offer at least some insights into the progression over time. The plot with linear y axis is remarkable in demonstrating how closely the various metrics track each other in terms of shape. The plot with logarithmic y axis is useful for monitoring the effective exponential growth rate over time. On a logarithmic y axis, exponential growth at a fixed rate would show up as a straight line. The very steep apparent growth in late March slowed significantly during April, and the data for the end of May and through June looks pretty linear (on the log scale plot), indicating relatively consistent exponential growth now albeit at a much reduced rate than March. September shows strong growth again. The seven-day moving average of daily totals is admittedly busy, but the phase relationship between the various statistics is much easier to see this way. The inclusion of public health directives helps provide some context to changes in the shapes of the curves.
After working the visualization problem for a few days, I began to wonder about how others were building models using this data to develop projections. Surely that kind of information would be super helpful for public health officials. That's where things got really interesting.
"No Confidence" in the Confidence Bounds
I've been following Andrew Gelman's blog for a handful of years now. It acts as a unique collection point for a variety of interesting statistical questions, and, even if I don't always fully appreciate the technicalities of some of the arguments, the general exposure to the way Bayesian statisticians think about problems has been educational. In the middle part of April, there was a discussion that came up around two modeling groups that were publishing COVID-19 projections with wildly different shapes to the confidence bounds. I've reproduced a couple of the plots below.
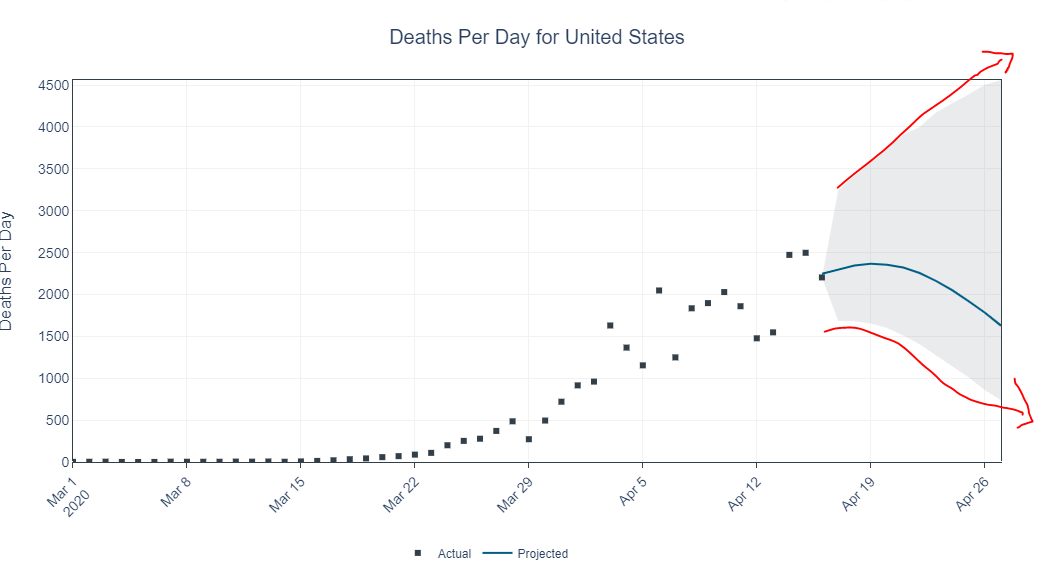
University of Texas COVID-19 projected deaths per day. Note the quickly diverging confidence bounds. (Source)
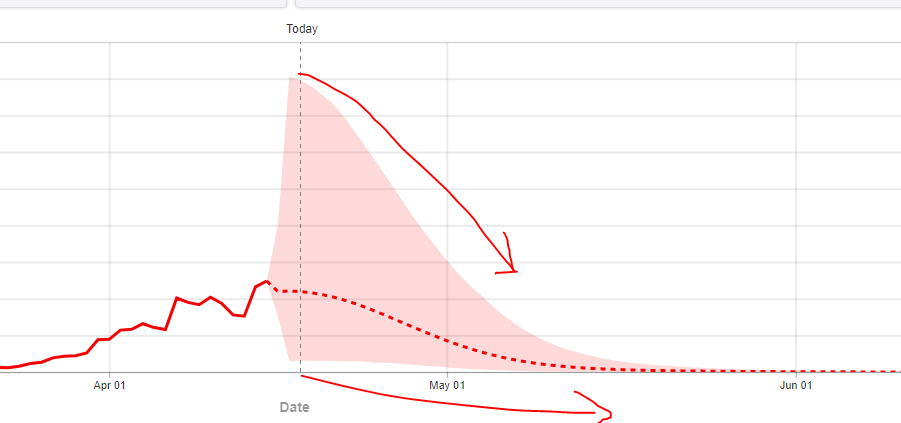
IHME COVID-19 projected deaths per day. Note the quickly converging confidence bounds. (Source)
If you can take any insight from these models it might be that projections from these types of models, especially so early in the progression of a pandemic, are incredibly uncertain. They depend heavily on assumptions about how previous pandemics have behaved, and there is no simple way to validate those assumptions with an unfamiliar disease in our modern societal context.
As far as facilitating informed decision making, the hope that statistical models like these might produce useful guidance seems dim. In that light, is there another type of model that might serve us better? From a policymaker's perspective, a pandemic like this gets managed day-to-day on little bits of new information, and decisions are executed with some risk that we are simply doing the wrong thing today which we won't discover until some later date. From that description, it might be more suitable to think about this as a problem in learning how to control a system with uncertain dynamics.
Controlling Systems with Uncertain Dynamics
I remember reading David McCullough's biography of the Wright brothers, which is loaded with insights into the genius of the two brothers. They were absolutely convinced that a critical piece of success in achieving flight would be to learn how to fly an aircraft. Engineering a machine that was capable of flight would not be enough because keeping such a machine aloft would require its own set of skills. Wilbur Wright once compared the process to that of learning to ride a horse. He contrasted two methods:
One is to get on him and learn by actual practice how each motion and trick may be best met; the other is to sit on a fence and watch the beast a while, and then retire to the house and at leisure figure out the best way of overcoming his jumps and kicks. The latter system is the safest, but the former, on the whole, turns out the larger proportion of good riders.
Coming back to flying, he emphasized the need for practical experience behind the controls.
But if you really wish to learn, you must mount a machine and become acquainted with its tricks by actual trial.
There would be no substitute for getting behind the controls and coming to grips with the reality that at first you don't know how much to move the levers at your disposal, how much was too much, how much was too little. The brothers together came up with a series of progressively more complex demonstration activities that allowed them to learn the dynamics of an unfamiliar aircraft system and develop the appropriate control reactions to keep it aloft.
In a pandemic, what are the controls available to us? Mask mandates, gathering restrictions, border shut-downs, stay-at-home orders, and quarantine periods are typical examples, each with some impact on both public health and economic outputs, the magnitude of which will not be well understood at first. In the face of this uncertainty, one strategy is to establish a safe steady-state operating point and then issue small changes on these control inputs to observe the system outputs in response. We've all experienced this first hand over the last several months, beginning with strict lock-downs to establish a safe operating point from a public health perspective followed by progressive re-opening plans and miscellaneous tweaking of restrictions and mandates in an attempt to restore economic progress.
In principle, this strategy seems so straightforward. In practice, it is incredibly difficult to execute well because the system we are dealing with in a pandemic has dynamics which are especially challenging to our human psychology. We are impatient. We don't like to wait. Furthermore, we expect our control actions to make a noticeable effect on outputs in a relatively short time window. In short, we are really bad at dealing with delay.
Feedback Systems with Time Delay
An exposure to the virus today will not yield a lab test result until many days later, and there are multiple points of delay in that chain of events. Exposure to symptoms, symptoms to lab test, lab test to results—these all accumulate into a very large delay between infection and detection. This delay has enormous practical consequences on our ability to exert control by feedback mechanisms.
Without delving deeply into control system theory, I'll simply state that delay pushes feedback systems toward instability. It causes systems with feedback loops to overshoot and oscillate around their desired targets.
A simple example from thermal systems illustrates the significant human weakness at dealing with slowly varying systems with built in delay. A classic experiment from Dörner's The Logic of Failure demonstrates this. The experiment involves human participants interacting with a simulated refrigeration system. He describes the premise of the experiment this way:
Imagine that you are the manager of a supermarket. One evening the janitor calls you up and tells you that the refrigeration system in the storeroom for diary products appears to have broken down. Large quantities of milk and milk products are in danger of spoiling. You rush to the store, where the janitor tells you he has already contacted company headquarters. They have dispatched refrigerator trucks to pick up the perishable goods, but it will take several hours for the trucks to arrive. Until they do, the perishables have to be kept from spoiling.
You find that the defective refrigeration system is equipped with a regulator and a thermometer. The regulator is still operational and can be used to influence the climate-control system and thus the temperature in the storeroom. However, the numbers on the regulator do not correspond to those on the thermometer. In general, a high regulator setting means a high temperature; a low setting, a low temperature. But you do not know what the exact relationship is between the regulator and the cooling system, and you have to find out what it is. The regulator has a range of settings between 0 and 200.
Participants were told to adjust the regulator setting to target a stable temperature of 4 degrees Celsius in the storeroom. Like real refrigeration systems, this simulated system had significant time lag between the moment that the regulator setting was changed and the time at which resulting temperature changes became apparent.
The plots below are a sampling of the performance from four participants. I won't attempt to review all of the implications here, but it's worth noting the enormous difference in performance between the very successful top participant and the completely erratic bottom participant. Dörner's analysis of the psychology at play in the various participants is worth reading, so consult the book for a full discussion. Of particular note is how the top performer made only small adjustments to the regulator setting at each change and them waited for quite some time to allow the system to respond before making new adjustments. Eventually the oscillations died out, and a relatively steady downward ramp toward the target resulted. In contrast, the bottom performer demonstrated rapid adjustments to the regulator, going from extreme to extreme or even reissuing the same extreme command multiple times. The result was sustained oscillations, never converging on the target.
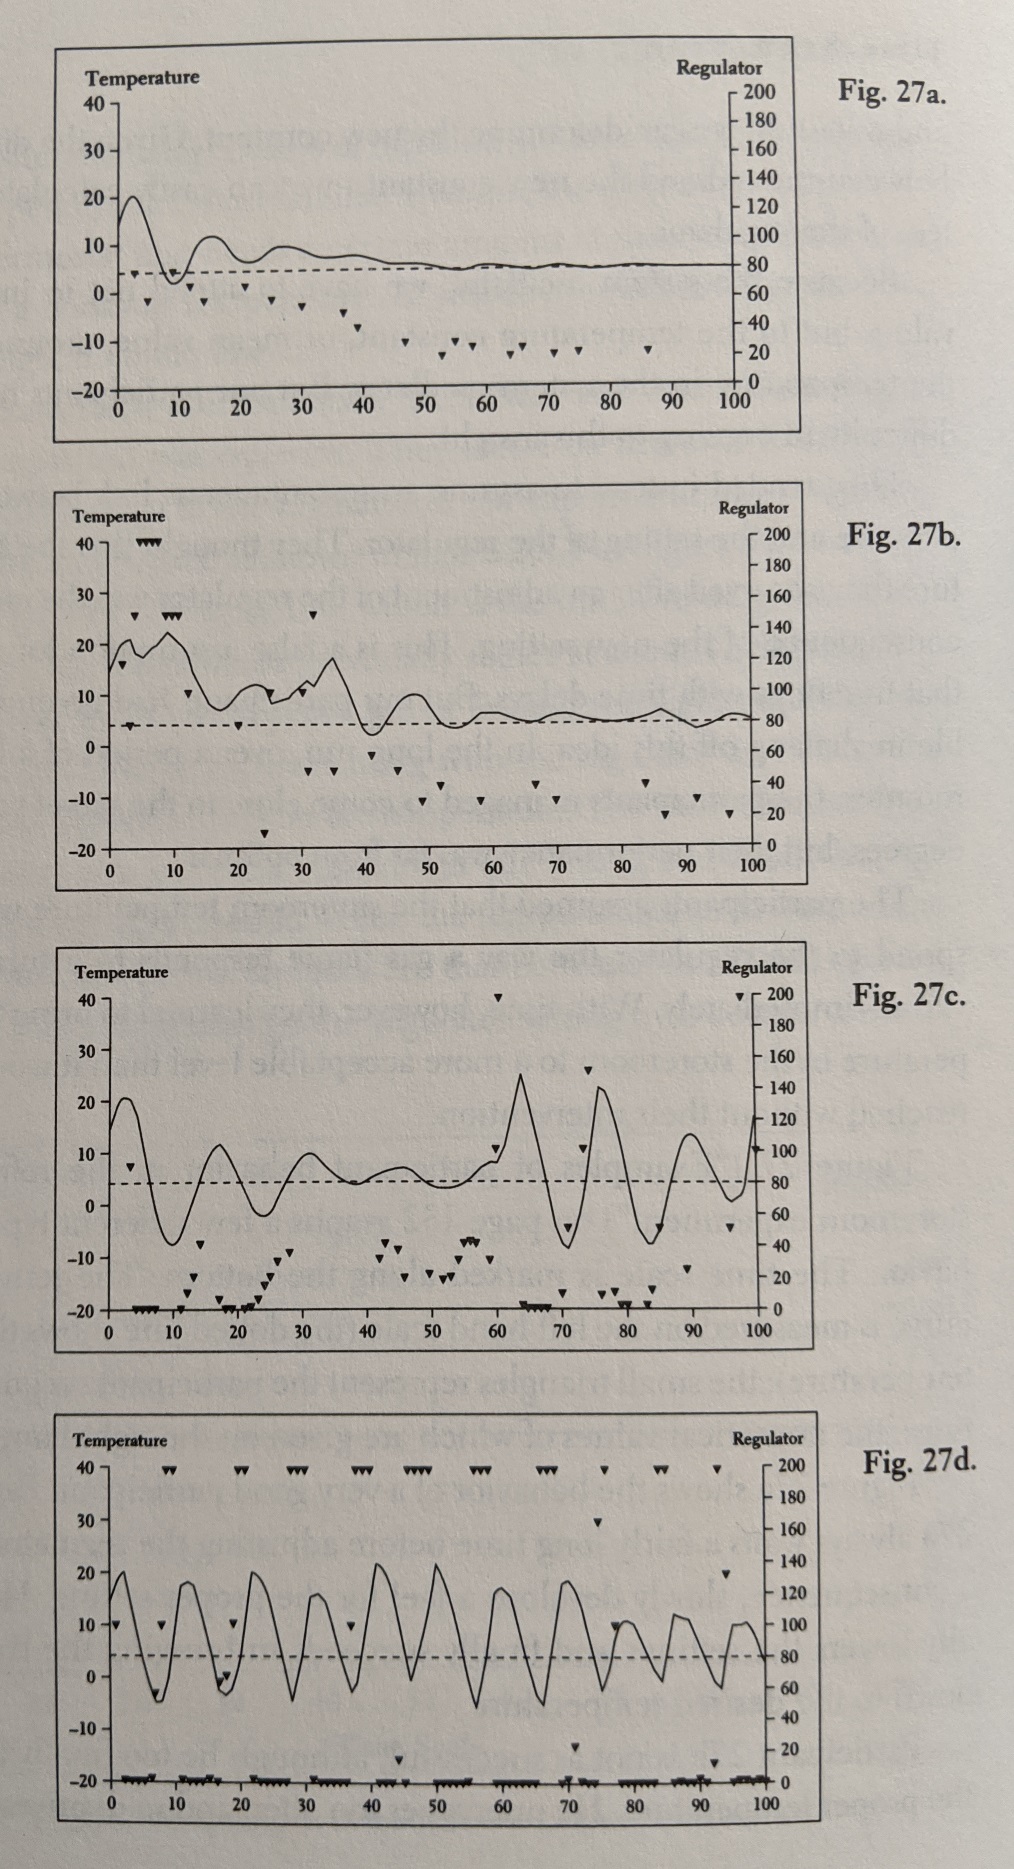
Plot of various participants' performance on the refrigerated storage room simulation experiment, from The Logic of Failure, p. 132. Solid lines represent storage room temperature readings (degrees C). Triangles represent regulator settings issued by the participants (unspecified units). The x axis is time (minutes).
Conclusions
From a policymaker's perspective, it feels like statistical models that attempt to project long-term pandemic trajectories are less helpful for managing the day-to-day decision making that must occur. It seems like more insight comes from thinking about a pandemic as an uncertain dynamic system, an unfamiliar aircraft that is already in flight, a malfunctioning refrigeration system that must remain in operation.
Pandemics have inherent delay in their dynamics, which complicates the system identification problem. To adequately learn the dynamics of a system with delay takes a long time because you have to make small control changes and then wait a long time for the oscillations to settle before making conclusions about the output. If you get impatient and make control perturbations that are too large you create disturbances that take a long time to settle out, you never really learn anything, and you risk destabilizing the system entirely.
As Dörner showed us, some humans are particularly adept at controlling systems with delay, and others are uniquely bad at it. I guess we can only hope that during a pandemic a handful of the adept are in positions that influence public health and economic policy.